对mysql语句的性能分析与优化
1.使用explain,查看查询计划
2.使用show processlist查看查询过程(处于哪个状态),完整命令如下 mysql -uroot -p -e ‘show processlist \G’ |grep state: |sort|uniq -c|sort -rn 此种方法和方法3类似,应该说方法3更好用。
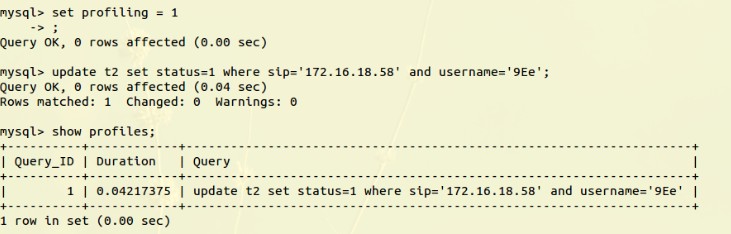
3.使用show profile。 默认是禁止的,需要使用set profiling = 1开启。执行一些查询后,键入show profiles可以看到前面执行语句的查询时间以很高的精度显示了出来。然后使用show profile for query n就可以看到对应查询语句的查询执行的每个步骤以及其花费的时间。
4.使用慢日志,并用第三方工具pt-query-digest生成分析报告。使用这种分析方法时,很有可能需要更改配置文件,可以设置成如下形式: log_slow_queries = /var/log/mysql/mysql-slow.log#日志的存放目录 long_query_time = 0 //捕获所有的查询 log-queries-not-using-indexes//即使不使用索引也可以被记录
在项目中发现程序执行的时间几乎全部消耗在了数据库的操作上。用pt-query-digest对慢查询日志做出分析报告(实际生产中无法方便的打开和关闭慢查询日志,此时可以通过监听TCP流量即使用tcpdump来模拟),发现update和insert操作占到了所有时间的95%。
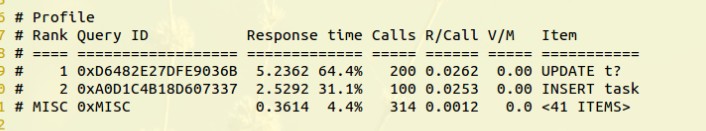
于是进一步分析执行的语句。
这条update语句各部分耗时如下:
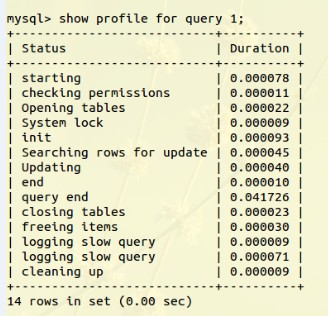
可以看出时间主要耗费在了query end状态中。
google上得到答案,将mysql的配置文件my.conf里加上一句innodb_flush_log_at_trx_commit = 0。 经过验证,成功解决问题,速度提升非常明显(上面的改动同时对insert操作也起了作用)。 同时留下疑问:query end是什么状态,为什么会用这么久的时间,为什么加上innodb_flush_log_at_trx_commit = 0后性能提升会这么大?
query end是什么状态? mysql的官方文档解释是:This state occurs after processing a query but before the freeing items state.我的理解是语句执行完毕了,但是还有一些后续工作没做完时的状态。
那么freeing items 又是什么状态呢? The thread has executed a command. Some freeing of items done during this state involves the query cache. This state is usually followed by cleaning up.就是释放查询缓存里面的空间(因为是update操作,所以相应的缓存里的记录就无效了,所以需要有这一步做处理)。
innodb_flush_log_at_trx_commit的默认值是1,此时的行为是: the log buffer is written out to the log file at each transaction commit and the flush to disk operation is performed on the log file。log buffer的作用:允许事务在执行完成之后才将日志(事务需要维护一个日志)写到磁盘上,时间主要应该就是耗费在磁盘IO上?
而将innodb_flush_log_at_trx_commit的值改为0后,行为如下: If the value of innodb_flush_log_at_trx_commit is 0, the log buffer is written out to the log file once per second and the flush to disk operation is performed on the log file, but nothing is done at a transaction commit。 可以看到,改成0后,本来应该每次提交都进行的操作,变成了每秒钟才进行一次,所以及大的节省了时间。
将innodb_flush_log_at_trx_commit的值设置为0有一个副作用:任何服务器端mysql程序的崩溃会导致最后一秒的事务丢失(还没来得及到到日志文件中)。但是考虑到本应用对事务不必有如此严格的要求,所以这是可以接受的。